When you’ve been delivering sports fans their news, entertainment and game coverage for 33 years, you tend to accumulate a lot of impressive statistics and factoids.
To help translate the size and scope of what ESPN does, Front Row presents:
ESPN By the Numbers, March 2013
Make up. . .
• 8 US cable networks with more than 18,000 hours of live event programming and more than 11,900 of live studio hours
• ESPN is in 98,516,000 homes nationwide and ESPN2 is in 98,477,000
• ESPN Audio presents 9,000 hours of talk/news/events to 24 million listeners a week via 450 affiliates (360 of which are full-time) including owned and operated stations in New York, Los Angeles, Chicago and Dallas
• ESPN Digital Media accounted for 29 percent of all sports category usage in January 2013, more than the Nos. 2, 3 and 4 sports properties combined
• ESPN the Magazine delivers more than 14 million readers with the average issue.
Our people. . .
• 7,000 worldwide employees (more than 4,000 based at headquarters in Bristol, Conn.)
• More than 1000 public facing commentators, analysts, hosts and writers
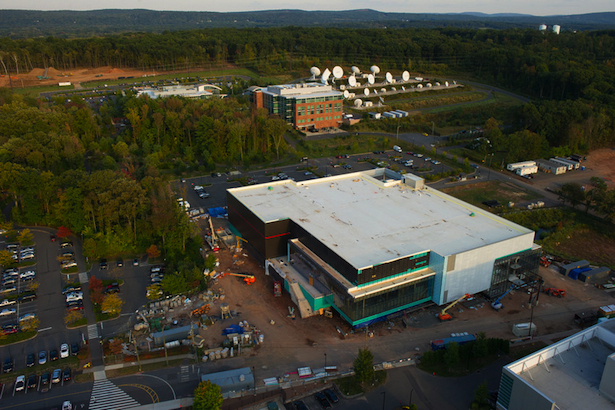
Our Connecticut campus. . .
• 1.35 Million square feet
• 123 Acres (87 in Bristol, Conn. and 36 in Southington, Conn.)
• 16 Buildings
• 27 Satellite dishes
• Additional facilities in Los Angeles, Charlotte and Austin
Digital Center 1
- 136,000 square feet
- 4 studios
- 8 production control rooms
- 22 edit suites
- 10 master control rooms
Digital Center 2 (Opening in 2014)
- 193,000 square feet
- 4 studios (including new home of SportsCenter)
- 6 production control rooms
Programming and ratings in 2012. . .
• In the fourth quarter, ESPN averaged more than 980,000 households on a 24-hour basis, and more than 2.3 M homes in prime time.
• ESPN Networks averaged 1.34M HH overall and 2.84M HH in prime.
• In prime, ESPN was the top-rated cable net overall, and among M18-34, M18-49 and M25-54.
• ESPN had the top 10 most-watched programs on cable, 14 of top 15 and 22 of top 25
• SportsCenter aired its 50,000th program in September
• 113 million different people use ESPN media each week
• The average person spends 6 hours, 57 minutes with ESPN media each week
ESPN Digital and Social Media. . .
In January 2013:
• In total ESPN digital properties attracted 62.6 million unique visitors, logging 4.97 billion minutes of usage
• Users watched 292 million ESPN digital video clips in January
• ESPN television content generated 13 million social comments, making it the “most social†cable network and the second most social network overall in January
• ESPN video content on YouTube generated 30 million views
In 2012:
• ESPN.com continued to lead the Sports Category with an average minute audience of 77,000, 52 percent higher than its closest competitor
• The five ESPN Local sites (New York, Los Angeles, Boston, Chicago and Dallas) averaged 8.8 million unique visitors per month
• Grantland.com averaged 2.2 million unique visitors and 26.8 million total minutes per month
• WatchESPN distribution (which includes live access to ESPN, ESPN2, ESPNU, ESPN3 and ESPN Goal Line/Buzzer Beater) is now available to more than 50 million households nationwide
• ESPN Mobile ranked No. 1 across the mobile Web and apps for total minutes (642 million), unique visitors (13.3 million), and an average minute audience of 14,600
ESPN’s value. . .Â
• Almost all Americans have heard of the ESPN Brand (98 percent); while a vast majority (93 percent) are familiar with it
• ESPN is the favorite network (broadcast or cable) among men
• In Beta Research Corp’s annual Cable Operator Evaluation Study, operators named ESPN the network with the most average perceived value among all networks measured for the 13th straight year
• ESPN also ranked the most important network in their cable system for the ninth straight year with 95 percent of operators describing ESPN as “very important†for subscriber retention and acquisition
• ESPN2 ranked second in average perceived value among cable operators for the eighth straight year. The network also ranked No. 5 as the most important network to operators among the 46 measured networks, up from No. 9 in 2011
Note: Digital traffic numbers are from comScore.